
Receiving results
Once your samples have been analysed, we'll email you your results. Every job comes with three things:
An Excel spreadsheet with your detections
An online sample report for each sample, viewable on our eDNA Explore Map
Raw FASTQ files containing all the sequencing data from your samples
Here's what's in each and how to make sense of it.
1 Excel spreadsheet
Your spreadsheet is made up of three tabs.
Metadata:
The job and sample information you entered on the sample submission form, plus extra details such as laboratory notes, the assays used, and your account information.
Aggregated:
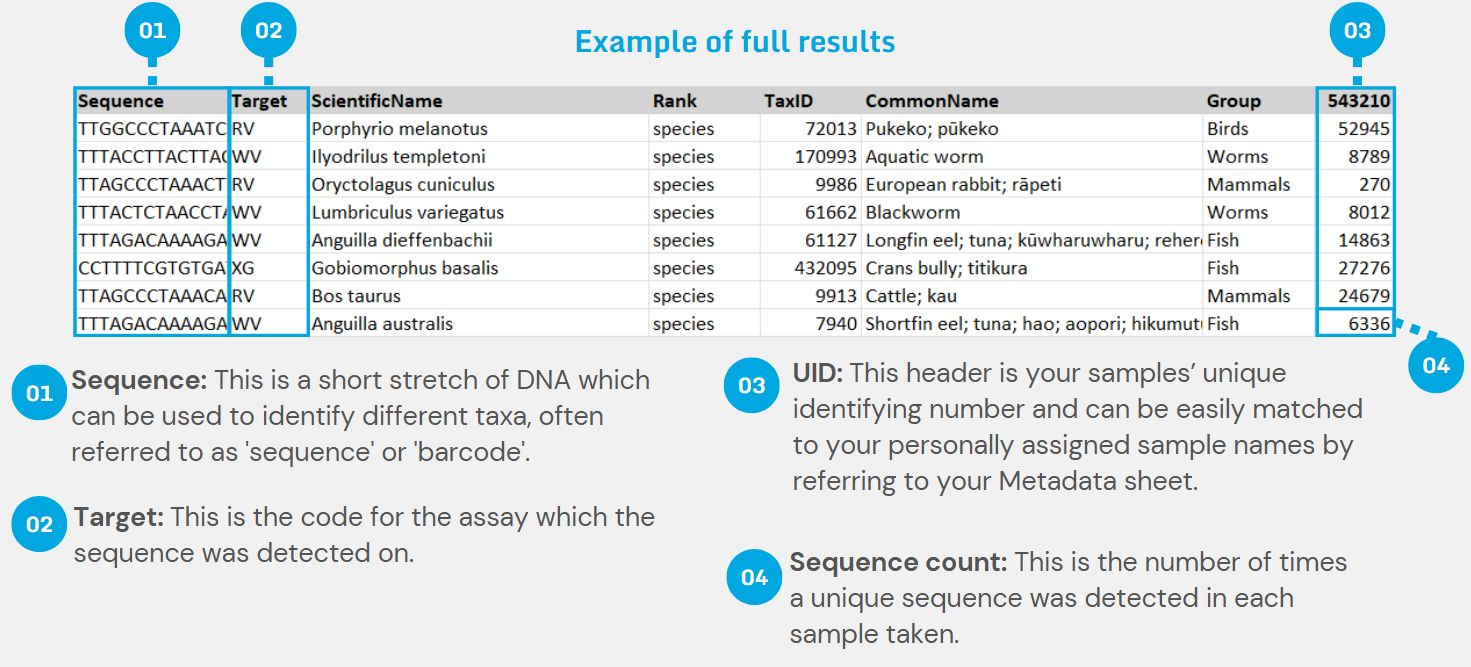
A simplified version of your results, with one row for each unique taxon (species, genus, etc.) found in your samples. DNA sequences are not included in this tab.
Full:
Your complete eDNA results, with one row for each unique DNA sequence found in your samples. This tab includes the DNA sequences themselves and the assay each one was detected on.
2 Online sample report
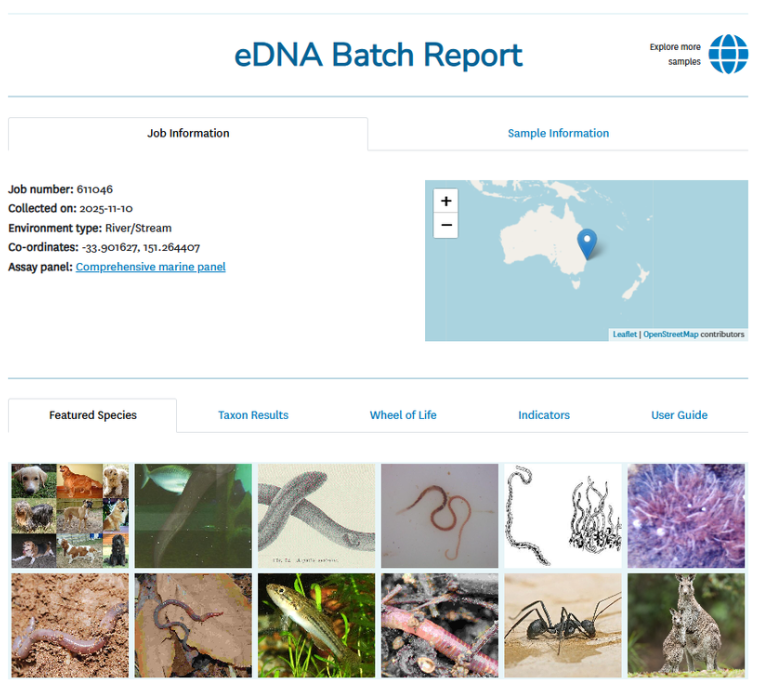
Each sample gets its own online report on our eDNA Explore Map. Reports are passcode protected, and your passcode is included in your results email. If you chose to make your results public when you submitted your samples, anyone can view them.
These reports are an interactive way to explore, communicate, and share your results. They include:
a searchable, filterable list of detected species
images of detected species
Wheel of Life
ecological health insights
Reports are updated as new reference sequences become available. For example, a sequence identified as "insect" today could be refined to Nesameletus (swimming mayfly) tomorrow. We're always looking for new ways to help you visualise and interpret your results, so the format and contents of these reports will continue to evolve.
eDNA Batch Report
Wheel of life
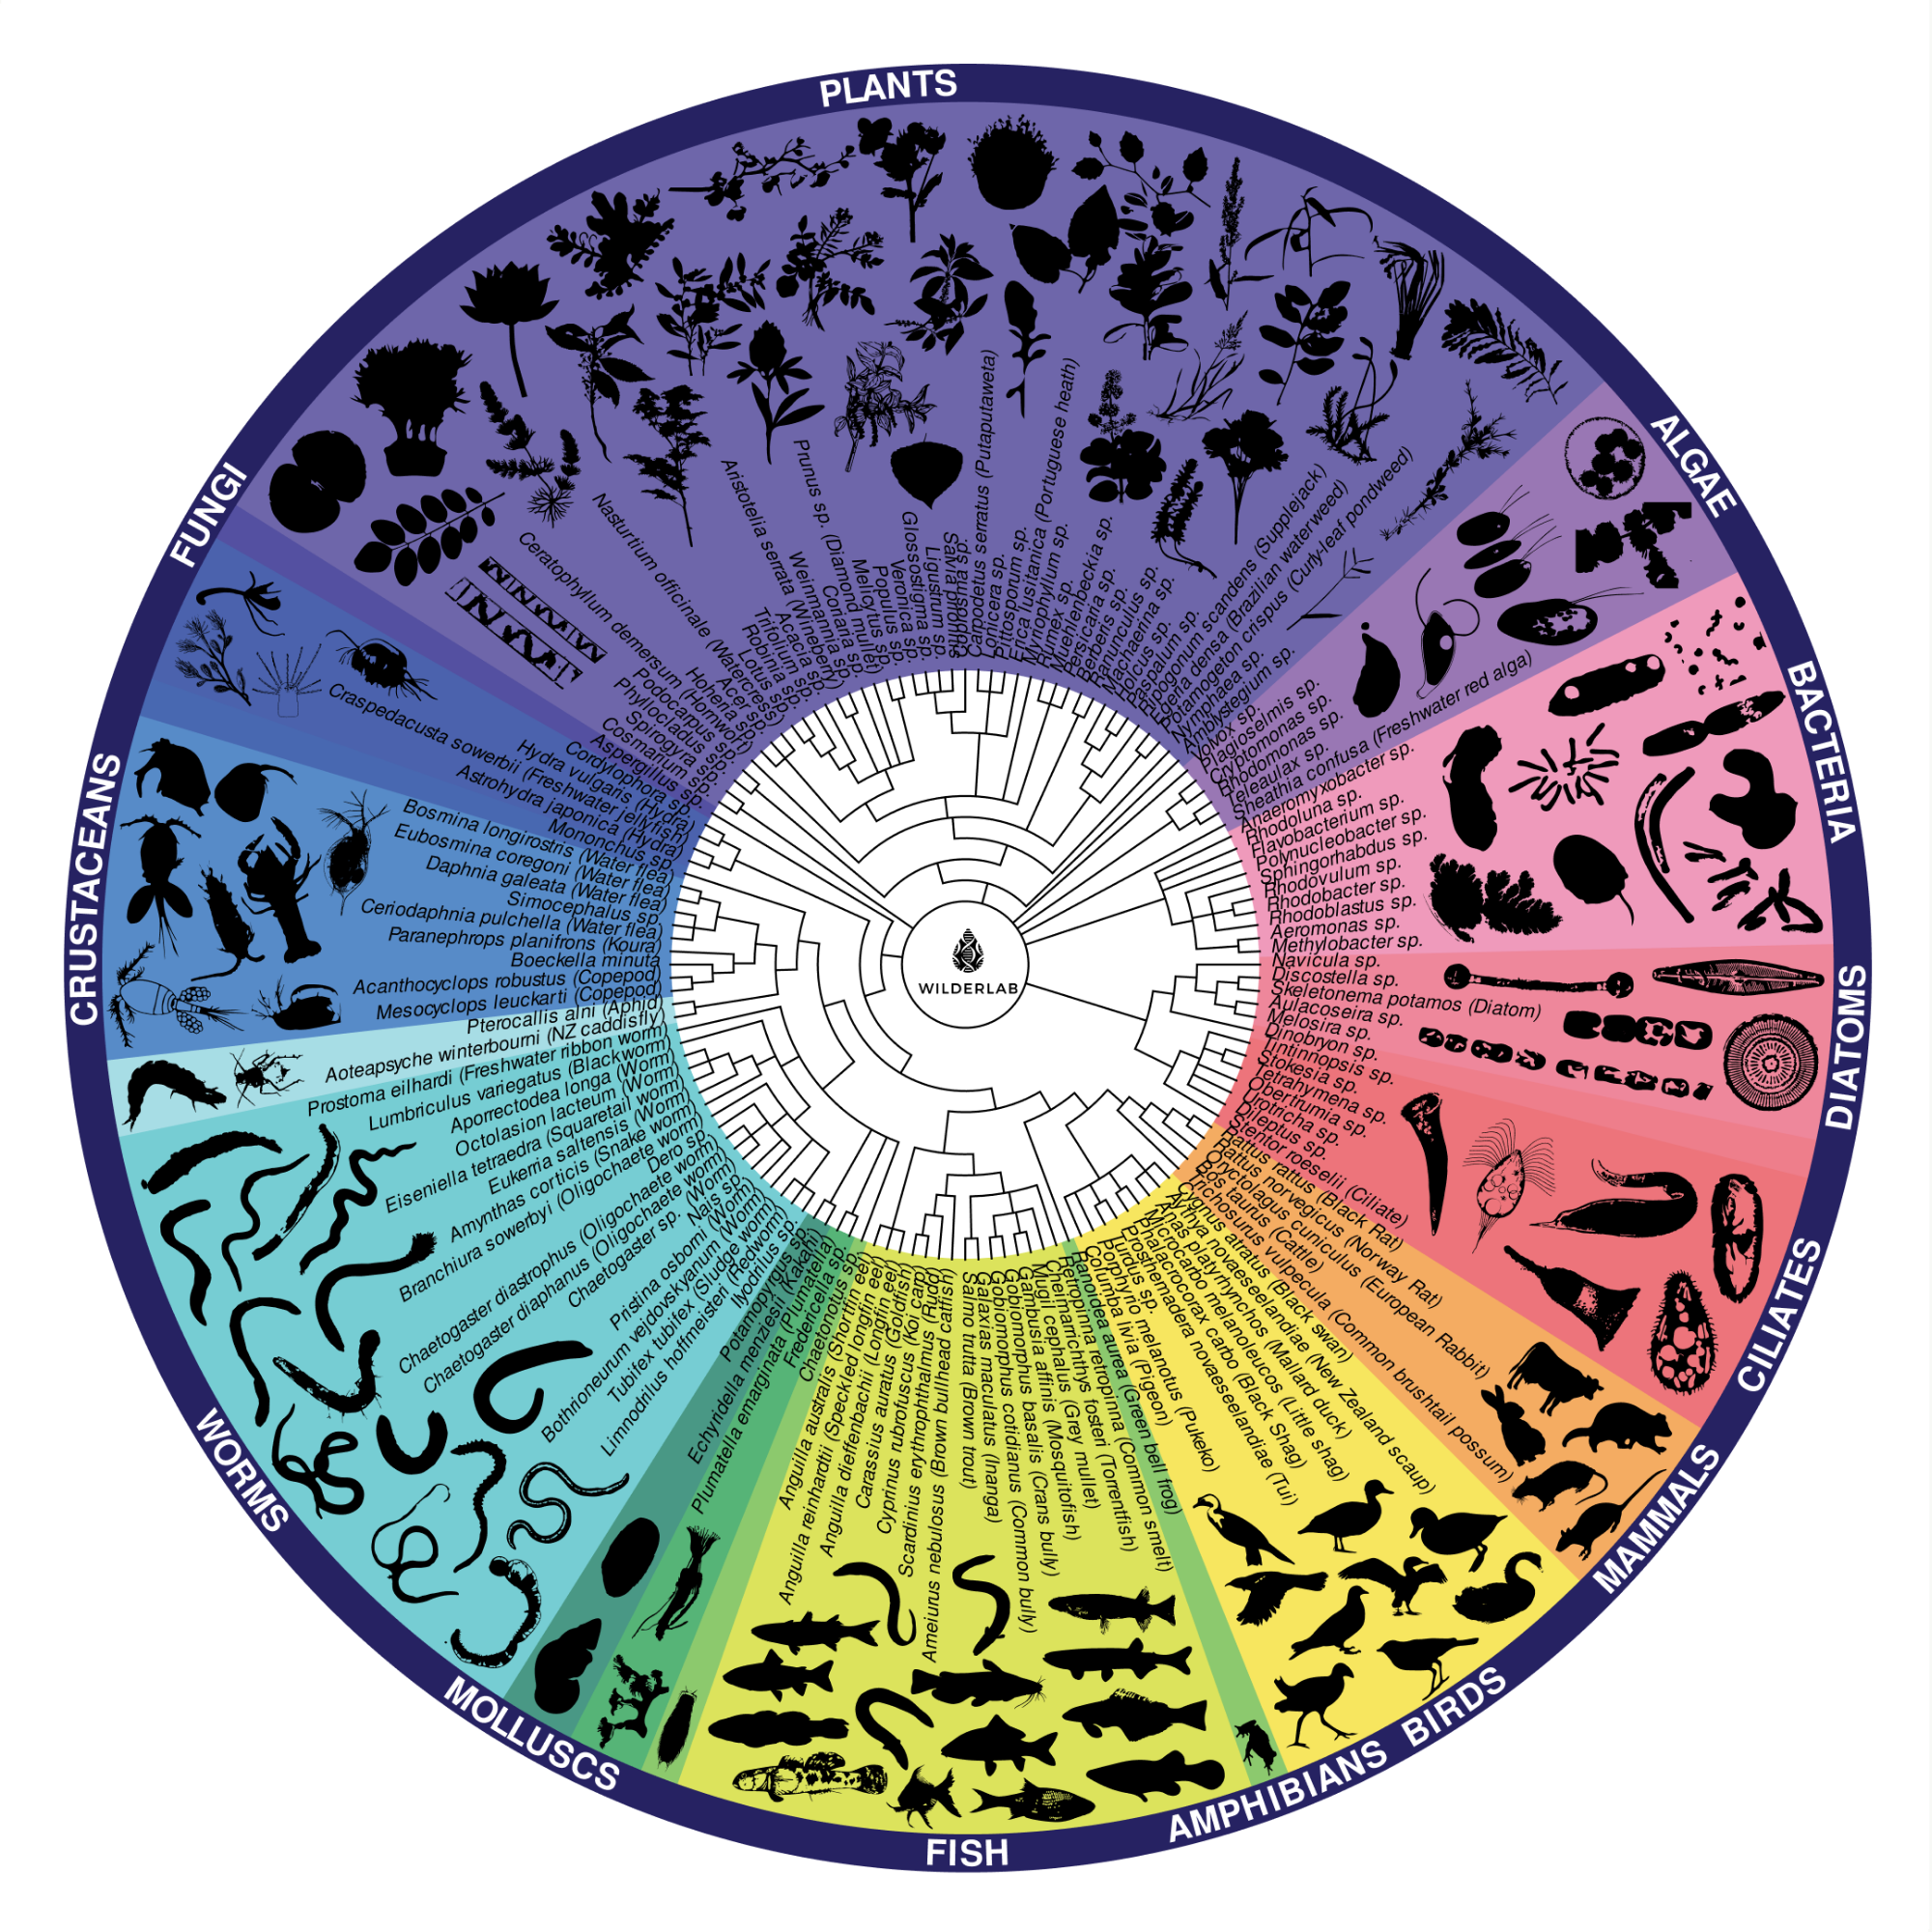
Our Wheel of Life diagrams are an easy way to visualise the biodiversity in your samples, grouped by taxonomic group. A Wheel is available on the online report for each sample or set of replicate samples.
You can also make your own using our Shiny Wheels app. Upload your results spreadsheet (.xlsx) or online report file (.csv), choose which groups to include, adjust the font and spacing, then download your wheel and the taxa silhouettes.
Broader ecological insights: TICI
The taxon-independent community index (TICI) is our riverine ecological health index, available for any river or stream sample processed with our Comprehensive Panel. It's similar to New Zealand's macroinvertebrate community index (MCI), except tolerance values are assigned to DNA sequences from across the tree of life, rather than just invertebrates.
To help you interpret your TICI score, we include:
TICI nseqs: the number of individual indicator sequences included in the score.
TICI reliability: how robust the score is, based on the number of composite tolerance values.
TICI quantile: where your score sits among 52 well known river sites around the country, sampled as part of a national eDNA trial carried out by Aotearoa's regional councils in 2021/2022.
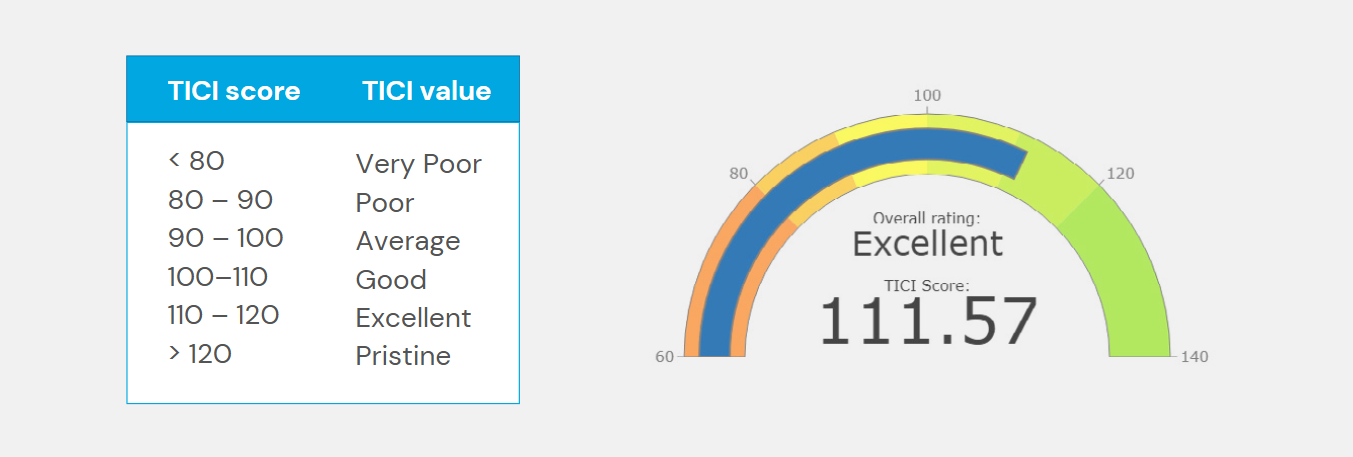
TICI rating: a qualitative rating that aligns with the MCI-hb scoring system.
TICI dial: a visual dial on your online sample report showing your TICI score.
3 Raw FASTQ files
We also send you the raw FASTQ files for your samples. These contain all of the sequencing data generated for your job, not just the sequences we were able to identify. They're useful if you'd like to run your own bioinformatics analysis, reanalyse your data against other reference databases, or archive your raw data for future use.
FASTQ files are delivered via a download link available in your results email.
Help us improve
If you notice any taxa that seem to be missing (for example, something found in high abundance near your sampling site), please let us know. We can often use this to improve our assay panels and reference database.
Understanding sequence counts
Several factors affect eDNA sequence counts, including:
how far organisms are from the sampling point
the presence of dead or decaying organisms
environmental conditions that speed up or slow down eDNA breakdown
assay biases, which can lead to some groups of organisms being detected more readily than others
Because of this, sequence counts can only loosely predict the abundance or biomass of organisms in the local environment. How you interpret them will depend on the question you're asking of your data.
Because eDNA testing is highly sensitive, a low sequence count in only a few replicate samples should be treated as a tentative detection. Depending on how important the taxon is, follow-up eDNA sampling or a similar biological survey should be used to confirm presence or absence.
Unexpected detections, or non-detections
Expected but not detected
Sometimes organisms you expected to find don't show up in your results. This can happen if the taxa are outside the scope of our assays, missing from the reference database, or if not enough replicates were taken. For most applications, we recommend taking 6 replicate samples at each site to maximise detections and reduce false negatives.
You'll usually see some unidentified sequences at the end of your results. These are a mix of organisms that haven't been described yet or aren't yet in a reference database. As new reference sequences become available, these can be updated, so the resolution of your data keeps improving over time.
Detected but not expected
Sometimes organisms you didn't expect to find are detected. Because eDNA testing is so sensitive, DNA can be carried into your sampling area by field gear, vehicles, run-off, and animal feces. This is where local knowledge of the site is especially valuable. Combined with an understanding of sequence counts, it can help you avoid misinterpreting results and false positives.